Extruded Polystyrene Delivers Higher R-Values than Expanded Polystyrene in Below-Grade Applications
Article
ABSTRACT
A new study from the Alaska University Transportation Center, University of Alaska Fairbanks (the Connor study [1]) recently reported on R-values measured on insulation removed from below grade applications in harsh climates, supplementing data from two previous similar studies [2, 3]. The three studies reported the in-service R-values per inch of extruded polystyrene (XPS) and expanded polystyrene (EPS) insulation installed under roads and airport runways with the time in service ranging from 1 to 31 years. The data from these three studies was combined for a more reliable determination of both XPS and EPS in-service performance in demanding below grade applications. The new data confirms previous results indicating higher R-value per inch for XPS compared to EPS. In fact, the new results indicate that the previous results underestimate the decrease in EPS thermal resistance over time. To deliver the same in-service R-value, EPS needs to be 1.5 to 2 times thicker than XPS.
INTRODUCTION
The R-value of polystyrene insulation under roads and airfields in cold climates is critical to protect infrastructure from damage caused by frost heave and permafrost thaw. Therefore, the primary factors affecting in-service R-value performance, such as aging and moisture absorption, must be taken into consideration. Architects, engineers, consultants and experienced construction specifiers interested in the long-term performance of polystyrene insulation will appreciate a new insightful report on test results from 15 field-extracted samples of polystyrene insulation from three different below-grade locations in cold climate regions of Alaska [1].
The Final Project Report of the Connor study [1] found the following:
- To deliver the same in-service R-value, EPS needs to be 1.5 to 2 times thicker than XPS.
- The new data points confirm previous results indicating higher R-value per inch for XPS compared to EPS. In fact, the new results indicate that the previous results underestimated the decrease in EPS thermal resistance over time.
- Small-scale laboratory comparative tests used to classify EPS and XPS products (such as ASTM C272 [4] or ASTM D2842 [5], referenced in material standards ASTM C578 [6] and CAN/ULC S701.1 [7]) do not fully account for the actual long-term R-value realized in the field.
- Newer EPS products did not translate to improved R-value performance evaluated after field extraction and years of exposure below grade.
- Moisture absorption with EPS has a much greater negative impact on R-value in-service than moisture absorption and aging with XPS.
BACKGROUND
Prior to the Connor study, the oldest XPS sample in the three reports was 25 years in service, and the oldest EPS sample was 15 years in service. The total number of combined data points for XPS and EPS was 18 and 7, respectively. The Connor study provided additional data for EPS and XPS insulation, especially at a longer service life, allowing for an updated comparative assessment over a similar range of years in service.
Earlier Studies
The Esch study [2] previously looked at 14.7 lane-miles of roadways and 9,750 feet of airfield runway constructed by the Alaska Department of Highways to control frost heaving and permafrost thawing. Insulation materials were installed below grade in these applications in the late 1960’s and extracted around 1984 for subsequent evaluation. The EPS samples were 3 and 15 years old; and the XPS samples were 3, 5, 10, 15, 20 and 25 years old.
The Pouliot and Savard study [3] later evaluated an experimental test roadway section approximately 385 meters long in Saints-Martyrs-Canadiens, Quebec (south of Quebec City) to compare the performance of uninsulated and insulated roadway sections using XPS and EPS. The roadway was constructed in 1995 and the XPS and EPS materials were extracted after 1, 3, 5 and 7 years in service.
Existing Thickness Ratios
A typical expression of a polystyrene insulation comparative assessment is in terms of a thickness ratio. The recommended EPS insulation thickness is obtained by multiplying the required XPS thickness by an EPS/XPS thickness ratio. For example, if the engineering design requires four inches of XPS and the recommended thickness ratio is 1.5 then the engineering specification should require an EPS thickness of 1.5 times four inches. Six inches of EPS would be required as an alternative to the four-inch XPS design specification. In the 1986 Esch Study, the recommended thickness ratio was 1.36. In the 2003 Pouliot and Savard study, the recommended thickness ratio was 1.20. In contrast, the Connor study suggests the thickness of EPS be increased to 1.5 to 2.0 times the thickness of XPS. An EPS/XPS thickness ratio typically is derived from existing design documents such as ASCE 32. For insulation installed in the horizontal orientation, the ASCE 32 standard for frost protected shallow foundations [8] and the International Residential Code [9] recommend a thickness ratio of 1.43 for Type IX EPS with R-2.8 design Rvalue compared to Type IV XPS with R-4.0 design R-value for horizontal placement of frost protected shallow foundation applications. These insulation Types have similar densities in ASTM C578. This calculated thickness ratio of 1.43 is based on an extensive literature review [10]. The thickness ratio of 1.43 as prescribed by ASCE 32 accounts for the uncertainty in the efficacy of foundation drainage measures and the possibility of more severe ground conditions occurring. Along with the two earlier studies, the Connor study further informs these prescribed thickness ratios. The severity of ground conditions varies from site to site and is exacerbated with years in service.
THE CONNOR STUDY
The Connor study provides new long-term, in-service data that provide additional insight into the moisture performance of past and recent EPS and XPS products. The data shows that the thermal and moisture performance of newer EPS products (after about five years in service) tracks well with older EPS products. The new data provides added confidence that the current thickness ratios as prescribed in ASCE 32 as well as the Esch study and the Pouliot and Savard study are valid or even underestimated. The data continues to validate the superior moisture and thermal performance of XPS in below grade applications.
The EPS samples in the Connor study were subject to below-grade conditions for five years (Dalton Highway, Alaska) and 21 years (Cripple Creek Highway, Alaska). The XPS insulation materials were subject to below grade conditions for 31 years (Golivan Airport, Alaska). These samples provide additional performance data for EPS and XPS after 21 and 31 years in service, respectively. The EPS and XPS samples extracted from the below grade locations were studied extensively. The researchers found a distinct difference in effective R-value and water absorption performance.
The multiple sites allow performance to be examined across a wide range of conditions with a sample size sufficient to reveal longer-term trends. During these long periods of time in service, the polystyrene insulation samples were exposed to the effects of aging, moisture absorption and drying, and compressive forces. Combining data from all three studies for EPS and XPS, respectively, sample sizes are 19 and 21; and the oldest ages in service are 21 and 31 years. The conclusions of R-value performance are quoted below and shown in Figure 1.
The Connor study test results indicate a rapid drop in R-value per inch for EPS in the first five years in service (with in-service R-values per inch ranging from 3.13 to 3.70). By comparison, the R-values per inch for XPS only gradually dropped after five years in service on previously measured XPS samples (with R-values per inch ranging from 4.51 to 5.15). Furthermore, the Connor study showed the R-values per inch for XPS decreased gradually, levelling out to an average value of about 4.1 after 31 years in service. By comparison, R-values per inch for EPS decreased rapidly, levelling out to an average value of about 2.2 after 21 years in service.
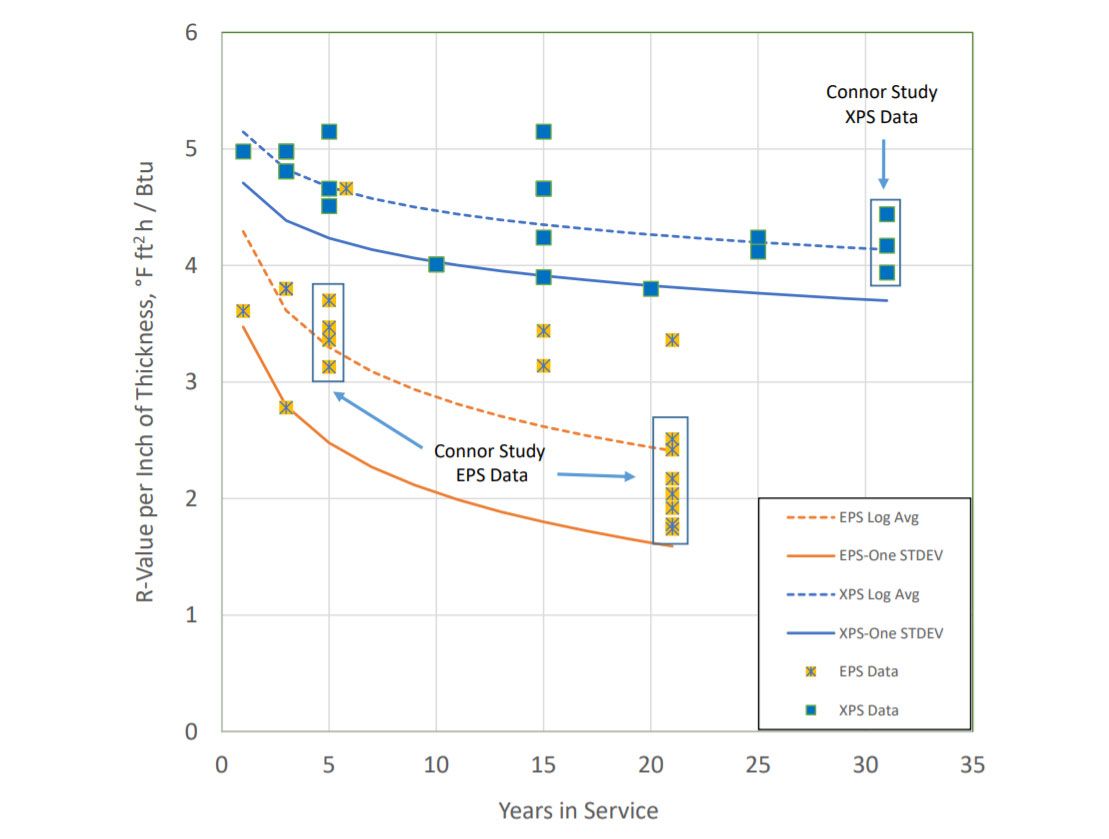 Figure 1: Thermal resistance (R-value per inch in units of °F hr ft2 / Btu) versus Years in Service. This graph plots the data points presented by Connor in tabular form. Also shown are the best fit average curve and the best fit average curve minus one standard deviation for EPS and XPS samples as given by Connor in equation form.
Figure 1 graphs the data points for in-service R-value per inch as reported in the Connor study. The new data points confirm previous results indicating higher R-value per inch for XPS compared to EPS. In fact, the new results indicate that the previous results underestimated the decrease in EPS thermal resistance over time.
The Connor study develops the concept of average in-service R-value per inch minus one standard deviation (solid line in Figure 1) as one way to calculate insulation thicknesses needed to account for in-service exposure to severe below-grade environments.
Several other procedures and corresponding multipliers are proposed to account for decreases in R-values per inch with the length of time in service. Regardless of the procedure, the Connor study concludes that EPS thicknesses need to be 1.5 to 2.0 times XPS thickness for EPS to equal the thermal performance of XPS.
IMPLICATIONS FOR FURTHER RESEARCH
Factors influencing the performance of an insulation in its application include R-values, moisture, temperature, aging, adjacent soil composition, water drainage and quality of installation. All XPS and EPS polystyrene products are classified into Types according to small-scale laboratory comparative tests using the ASTM C578 [6], CAN/ULC S701.1 [7] or AASHTO M230 [11] specifications. It is misleading to extrapolate these small-scale results to imply an exact representation (or design value) of field performance, especially considering the many variables mentioned above.
For example, Long-Term Thermal Resistance (LTTR) [12], or aging, which is based on a shortterm small-scale laboratory test, is assumed by some to be the design R-value and the single most important product criteria. This is an inaccurate assumption. A single, small-scale test characteristic such as aging does not accurately predict the in-service design thermal resistance of an insulation, especially when the actual field-verified performance of the insulation has already been confirmed in extreme real-life environments.
Furthermore, a field study in one region of the country may not accurately predict the same performance in all regions of the country, considering the different climates and soil conditions. Fortunately, these three studies examined multiple climates with severe freeze/thaw cycling such as Fairbanks, Alaska and Quebec, Canada. The studies provide critical long-term data, whereas the small-scale testing methods used to classify polystyrene are not indicative of long-term performance. The specifier is responsible to ensure this research data is applicable to their climatic region.
Another important finding of the Connor study points to the drawbacks of using small-scale moisture absorption testing as a predictor of in-service performance. Besides measurements of R-value per inch, moisture absorption was measured on all of the samples. The Connor study sought to correlate “Water by Volume” data points with the R-value per inch data points. One EPS product claimed to have the same moisture absorption as XPS based on small-scale laboratory testing (as required by ASTM C578) yet the in-service performance was substantially different.
In other words, the improved EPS small-scale moisture absorption test results did not statistically improve the already rapid EPS R-value degradation due to moisture absorption in service. In these studies, the relative difference in moisture absorption helps to explain the degradation in Rvalues below grade when in service. XPS absorbed less moisture than EPS on average in all of the studies; hence the need for a thickness ratio applied to EPS products.
SUMMARY AND CONCLUSIONS
In summary, through scientific study and empirical evidence, the resilience of XPS has been reaffirmed.
The study suggests that small-scale tests used to classify products per material standards ASTM C578 or CAN/ULC S701.1 do not account for the actual performance reductions in the field. Moisture absorption with EPS has a much greater negative impact on R-value in-service than moisture absorption and aging with XPS. In these harsh below-grade applications, the research indicates that after moisture absorption very little drying of EPS and XPS occurs in-service.
As the most recent of three such studies, the Connor study confirms the higher thermal resistance of XPS compared to EPS, attributing it to the lower moisture absorption of XPS compared to EPS; furthermore, it recommends an EPS-to-XPS thickness ratio of 1.5 to 2.0.
Note: A version of this study, including authors, acknowledgements, and references can be found here on the Extruded Polystyrene Foam Association website.

© 2022 DuPont de Nemours, Inc. All rights reserved. DuPont™, the DuPont Oval Logo, and all products, unless otherwise noted, denoted with ™, ℠ or ® are trademarks, service marks or registered trademarks of affiliates of DuPont de Nemours, Inc.